
This post attempts to compare the rates of obesity in various countries with their relative rates of cycling. Have you ever wondered if more cycling would mean a thinner nation? Less obesity, less diabetes, less heart disease, longer life – all those good things? After all, it is widely accepted that physical activity, such as bicycling, is a crucial factor in maintaining a healthy weight and preventing obesity. Well, here’s some research comparing rates of obesity with rates of cycling. We show that more cycling really would have all those good results.

 It’s kind of hard not to notice the difference – a lot of cyclists do seem to be in better shape than a lot of non-cyclists. But … random observations are not science … So we took a look at the research
Research into the Relationship Between Rates of Bicycling and Obesity in 8 Major Countries
Data Overview
Our analysis compared eight countries with varying levels of obesity and bicycling rates:
- Netherlands
- Denmark
- Germany
- Sweden
- USA
- Canada
- Australia
- UK
We compiled the obesity rates and bicycling rates from reputable health and transportation databases.
Findings on the Relationship Between Cycling and Obesity Rates
Obesity Rates (%) and Bicycling Rates (%)
We are presenting this information in three different ways to make it as clear as possible. First, two different graphs, and then an explanation of the graphs.

 Graph showing the relationship between cycling and obesity rates in graphical form
 Graph showing the relationship between cycling and obesity rates
Correlation Analysis
The correlation coefficient between obesity rates and bicycling rates across these countries is -0.766. This strong negative correlation suggests that higher bicycling rates are associated with lower obesity rates.
Interpretation of the Data on the Relationship Between Cycling and Obesity Rates
- Netherlands and Denmark: High bicycling rates (36% and 23%, respectively) correlate with lower obesity rates (20.4% and 19.7%).
- USA and Canada: Low bicycling rates (1% and 1.2%, respectively) correlate with high obesity rates (36.2% and 29.4%).
- Germany and Sweden: Moderate bicycling rates (11% and 12%) show relatively lower obesity rates (22.3% and 20.6%).
- Australia and UK: Both countries show low bicycling rates (1.5% and 2%) and higher obesity rates (29% and 27.8%).
 |  |
 |  |
 | |
Conclusion on the Relationship Between Cycling and Obesity Rates
This analysis reveals a significant inverse relationship between bicycling rates and obesity rates. Countries with higher rates of bicycling tend to have lower rates of obesity, suggesting that promoting bicycling as a mode of transportation and exercise could be an effective strategy in combating obesity.
Research into the Correlation between Obesity and Active Transportation in General
Apart from the above carefully researched correlations, there’s also a group of researchers who studied the correlation between active transportation (cycling, walking, transit) and obesity, and found that:
“Walking and bicycling are much more common in European nations than in the United States, Canada, and Australia. The current study shows that there is an inverse association between active transportation and obesity rates in these countries.”
They also concluded that:
“Studies conducted in Sweden, the United States, and Australia have found that individuals who perform active transportation have a decreased odds ratio of obesity.”
In English: people who bike or walk a lot are much less likely to be fat.
Bottom Line on the Relationship Between Cycling and Obesity Rates
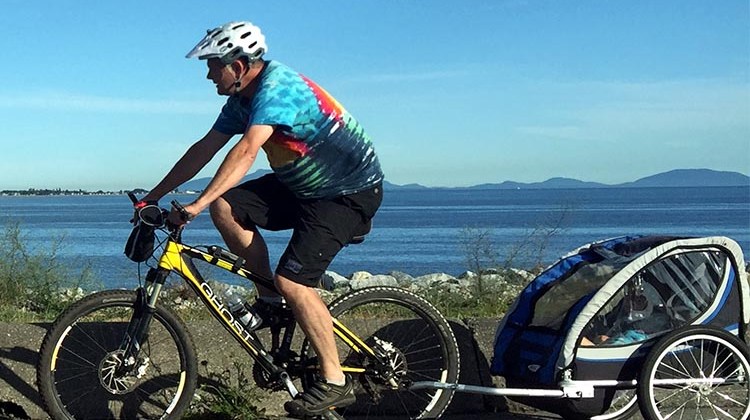
All of the above is good enough for me. I’m going to keep on cycling. And I have to add that it has worked for me … just witness the photo below which shows how cycling has whittled away at my weight. During all of the years that I have cycled so far, I have slowly lost weight. With the result that as I am aging, I am getting slimmer, rather than fatter.

 Over many years of slow cycling, I have slowly lost weight!
 |  |
| |
 | |
Related Posts
Related Post: A Guide for Fat Cyclists
Related Post: 5 Quick and Easy Tips to Lose Weight Cycling
Related Post: Top 10 Tips to Lose Weight Cycling
Related Post: How Many Calories Can You Burn Cycling?
Related Post: 7 Steps to Lose Weight by Cycling
Sources Used to Write this Post
Australian Institute of Health and Welfare – National Health Survey.
Centers for Disease Control and Prevention (CDC) – National Health and Nutrition Examination Survey.
European Cyclists’ Federation (ECF) – Cycling data and reports.
OECD Health Statistics.
Public Health Agency of Canada – Canadian Community Health Survey.
Swedish National Institute of Public Health.
UK National Health Service (NHS) – Health Survey for England.
World Health Organization (WHO) – Global Health Observatory data repository.
The above sources provide comprehensive data and insights into health and transportation patterns, underpinning the conclusions in our post.
Check Out Our Most Popular Posts! | ||
| ||
Did you enjoy this post or find it helpful? If so, please support our blog! We write this blog because we love cycling. But we also need to earn a living, so we would appreciate it very much if you click through to one of our reputable affiliates for your online shopping. We are proudly affiliated with Amazon, which sells pretty much everything, and has outstanding shipping and return policies. When you buy from our affiliates we make a small commission, and this is the only way we earn any income. Plus, it costs you nothing at all - a real win/win situation! We here at Average Joe Cyclist do not receive any information AT ALL about who you are, where you live, or what your dog's name is. Buying through our Amazon links is simply an anonymous way to thank us for our efforts, like tossing a few coins in a tip jar. Except that it is Amazon who tosses the coins, not you! | ||
")


")
")


")
")
")

")


")
")


")


Leave a Reply